ResourceIQ
A full-stack reporting & analytics platform that turns Excel resource reports into live dashboards.
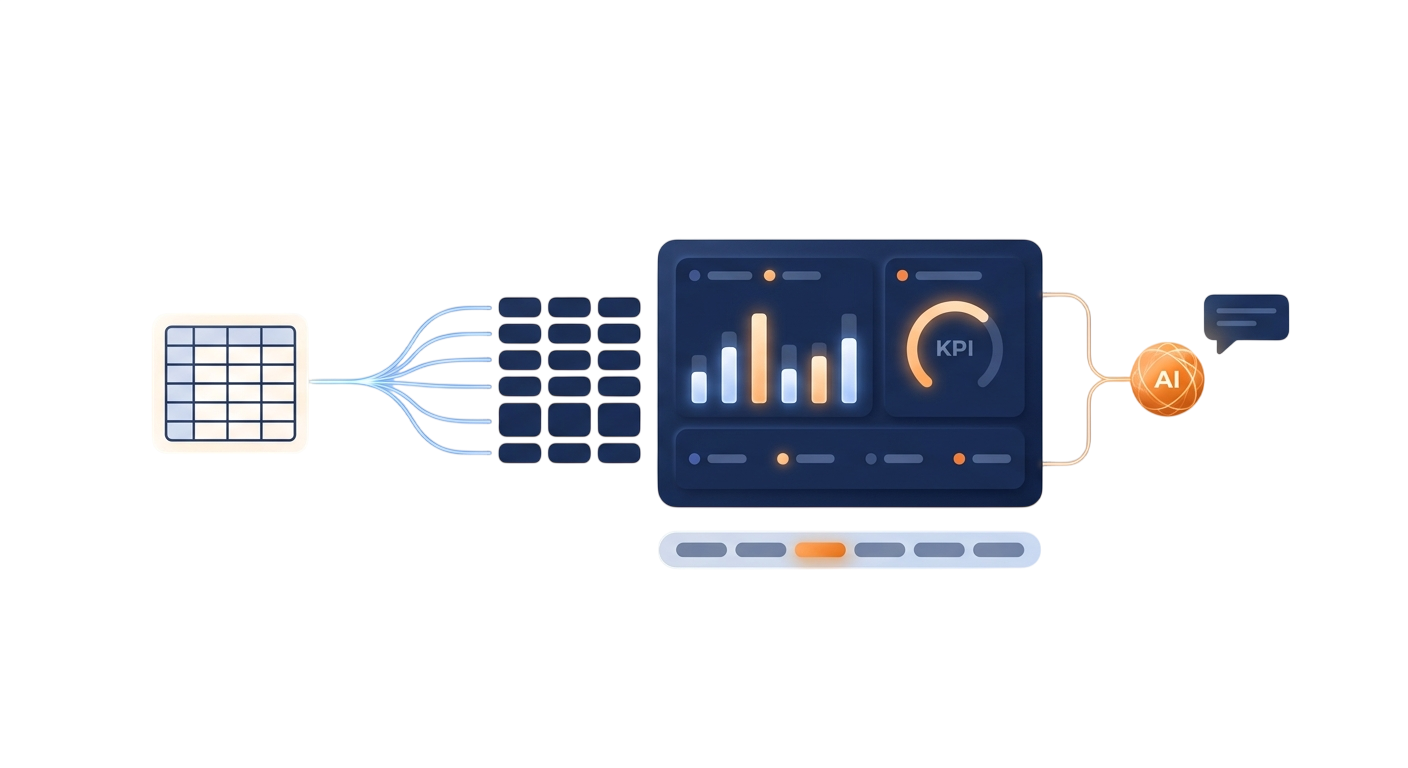
A full-stack reporting and analytics platform built to manage resource-utilization data for CTL operations. Users upload Excel-based resource reports, the system processes them into structured data, and dashboards surface workforce performance, department trends, employee utilization, and reporting history — with an AI assistant on top to answer questions about it all.
Resource data lived in raw Excel reports that had to be read and interpreted by hand — slow, inconsistent, and impossible to compare across periods. The platform had to ingest messy spreadsheets with varying columns, normalise them into a shared model, and expose the result safely so each user sees only the data their role allows.
Upload & import pipeline
Excel files are parsed on the backend, column headers are analysed and suggested through AI mapping, and the data is transformed into structured records for employees, departments, and hours — then stored and linked to a reporting period.
Period-based analytics
Data is grouped by reporting periods such as weekly or annual cycles, so charts and summaries recalculate for the selected (or latest) period — making performance easy to compare across time.
Department & employee insights
The system computes hours logged, billable hours, overhead hours, leave hours, and utilization percentages, with filters by employee type, status, department scope, and view scope — from broad org trends down to a single team.
Role-based access & permissions
Different roles reach different parts of the system — some upload, review, or manage data while others only view dashboards — enforced by backend middleware for authentication, role checks, and scoped access so sensitive data stays hidden.
AI-assisted reporting
A chat module answers natural-language questions about performance, utilization, and department metrics by retrieving the relevant uploaded report, building a context summary, and passing it to the model — grounded strictly in real uploaded data, so it never invents answers.
Full-stack REST architecture
Separate React (Vite) frontend and Node.js / Express backend communicate over REST, with the backend organised into routes, controllers, services, and middleware.
Secure auth & sessions
JWT and cookie-based authentication handle secure access, with middleware determining what each user is allowed to see or do based on identity and role.
PostgreSQL data model & ETL
Report periods, employee/resource data, departments, uploads, and chat messages are modelled in PostgreSQL; Excel files are imported, transformed, and inserted into analytics tables in an ETL-style pipeline (multer + xlsx).
Dashboards, export & RAG chat
Chart.js and react-chartjs-2 render KPIs and charts, html2canvas / jsPDF and pdfkit handle exports, and the Anthropic AI SDK powers RAG-style chat that answers from retrieved report context.
Have a project like this?
Tell us what you're building — thirty minutes with an engineer, not a salesperson.